Data Commons
Data Commons is an international project that aggregates data from a wide range of sources—including RFF—into a unified database. RFF’s Data Commons microsite explores datasets relevant to RFF’s research priorities. It also provides users access to visualization tools and a seamless way to explore relationships between RFF data and the extensive Data Commons catalog.
Extreme Heat
Screenshot from Data Commons
View Timeline
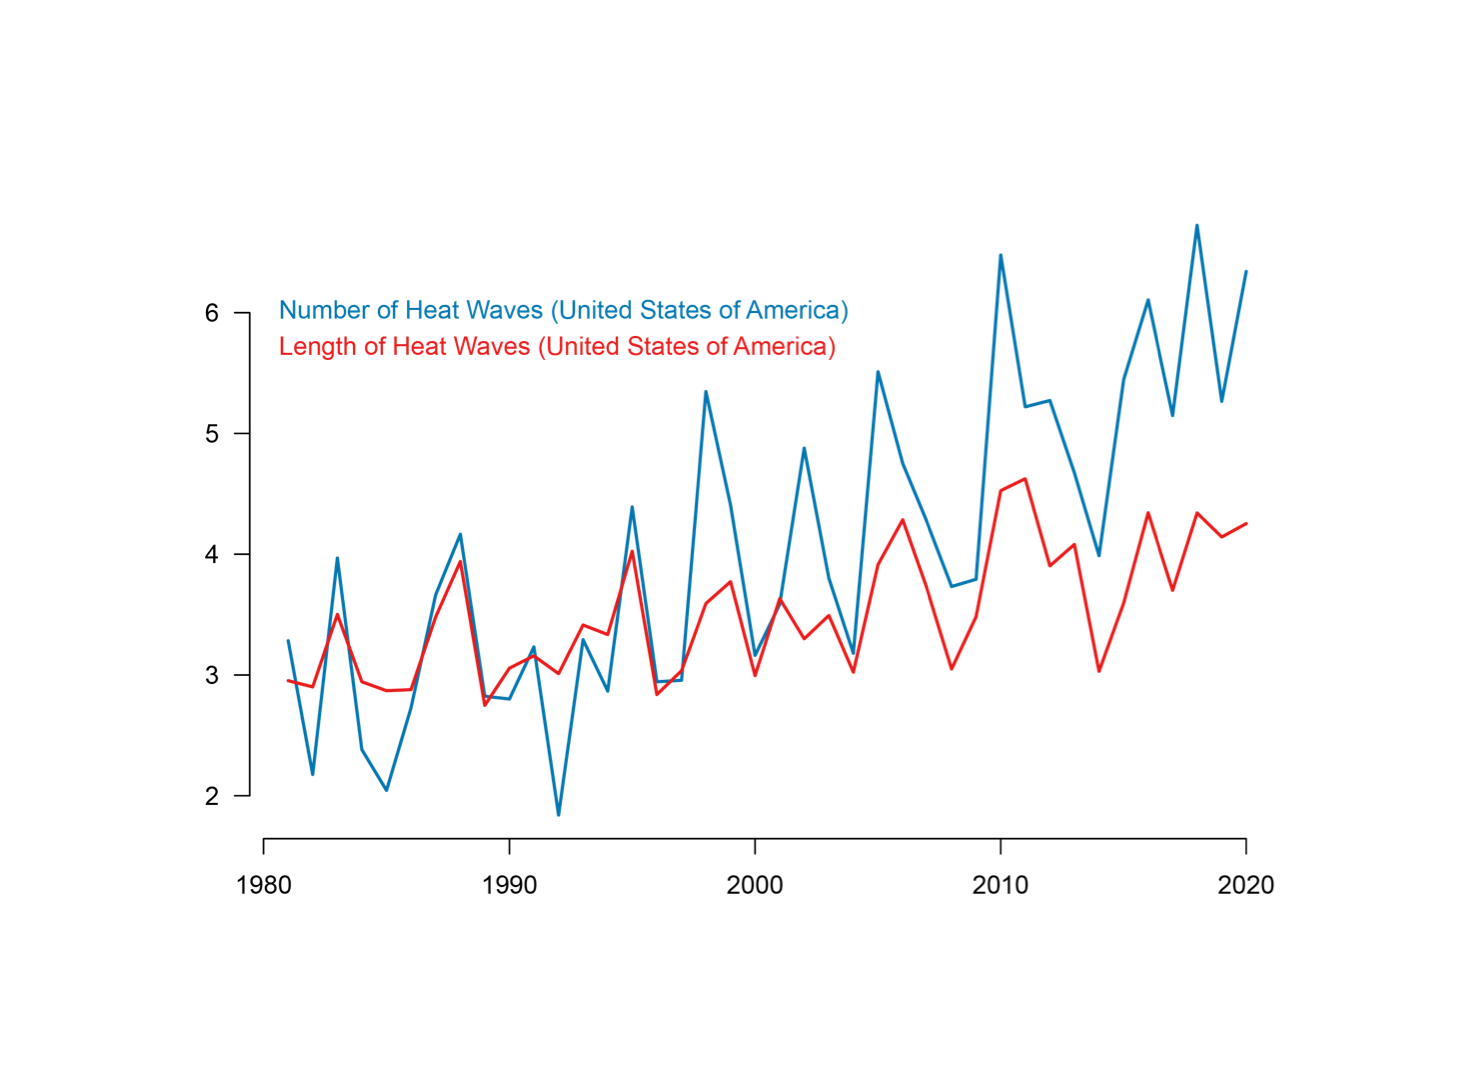
Americans are more likely to experience heat waves now than in the past

In the United States, exposure to extreme heat is on the rise. The average American went from experiencing three heat waves per year during the 1980s to five heat waves per year during the 2010s. Heat waves also have become more severe over time. In recent years, the average heat wave has lasted about four days—one day longer than the average heat wave in the 1980s. Heat waves are not just uncomfortable—they also can lead to lasting impacts on people and the economy. Numerous studies have linked extreme heat with illness and death among vulnerable populations, such as older adults, very young children, and those with chronic health conditions; harm to crops; increased risk of wildfires; and damage to essential services like transportation and energy systems.

Screenshot from Data Commons
View Maps
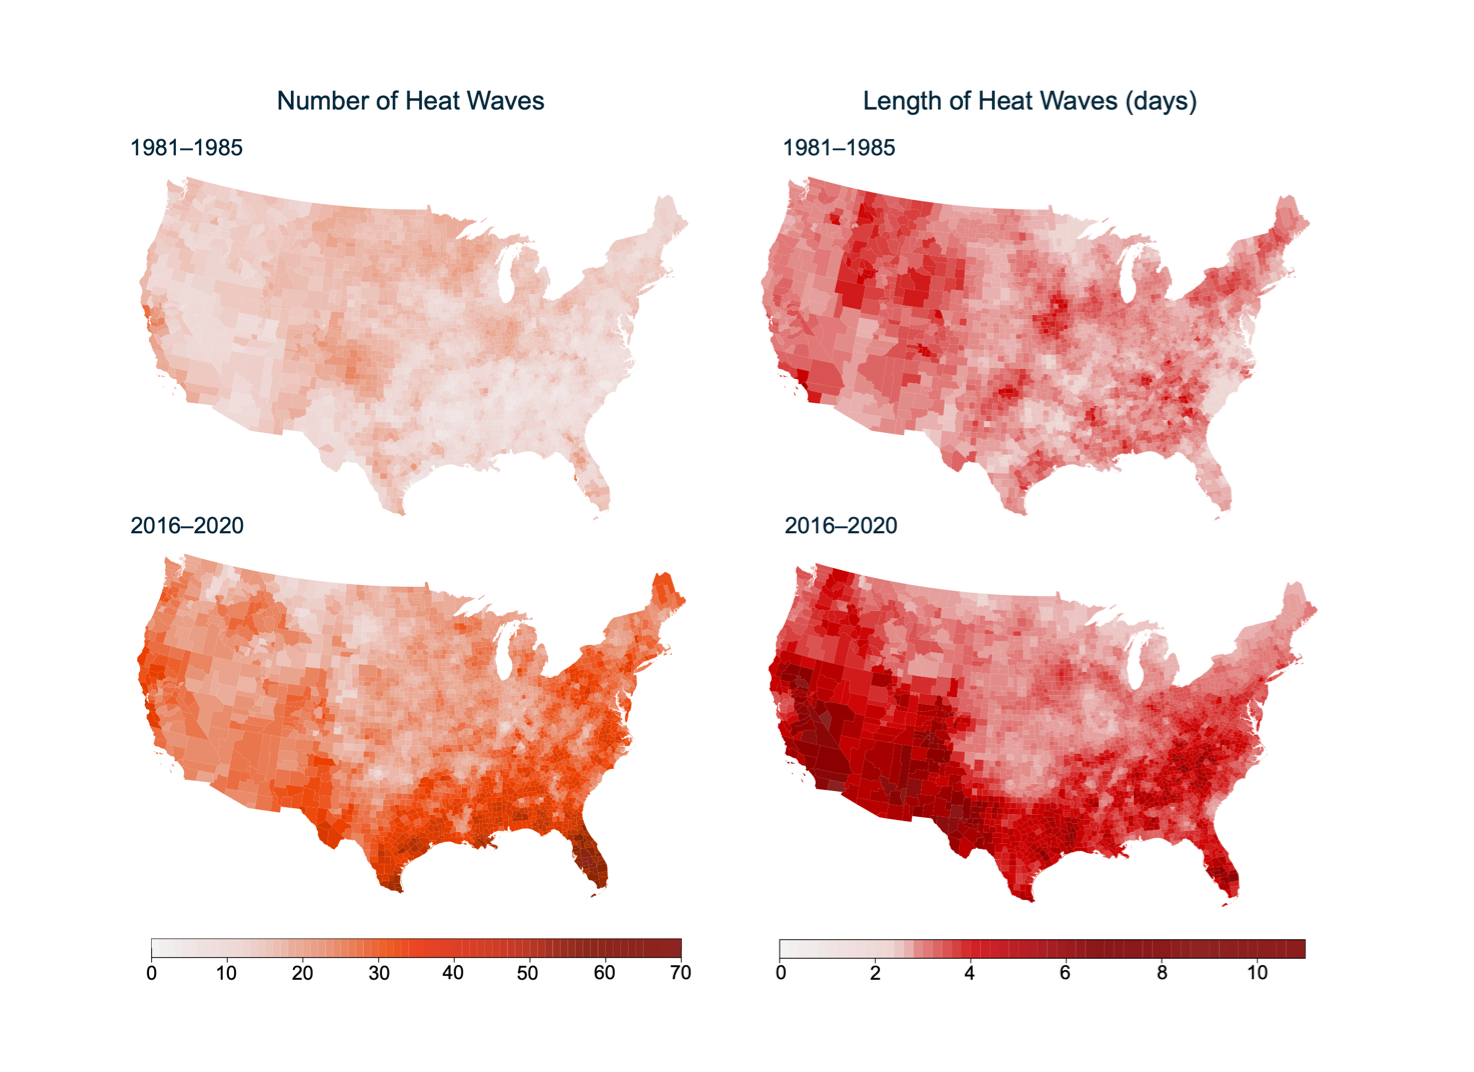
Heat waves are becoming more frequent and more intense

Almost all regions of the United States have experienced a significant increase in extreme heat exposure over the last several decades, but the trend is most concerning in the southern United States, where some counties are now experiencing more than 10 heat waves per year, on average. The average length of heat waves has increased the most in the southern and western United States and now exceeds five days in much of the country.

Screenshot from Data Commons
View Scatterplot
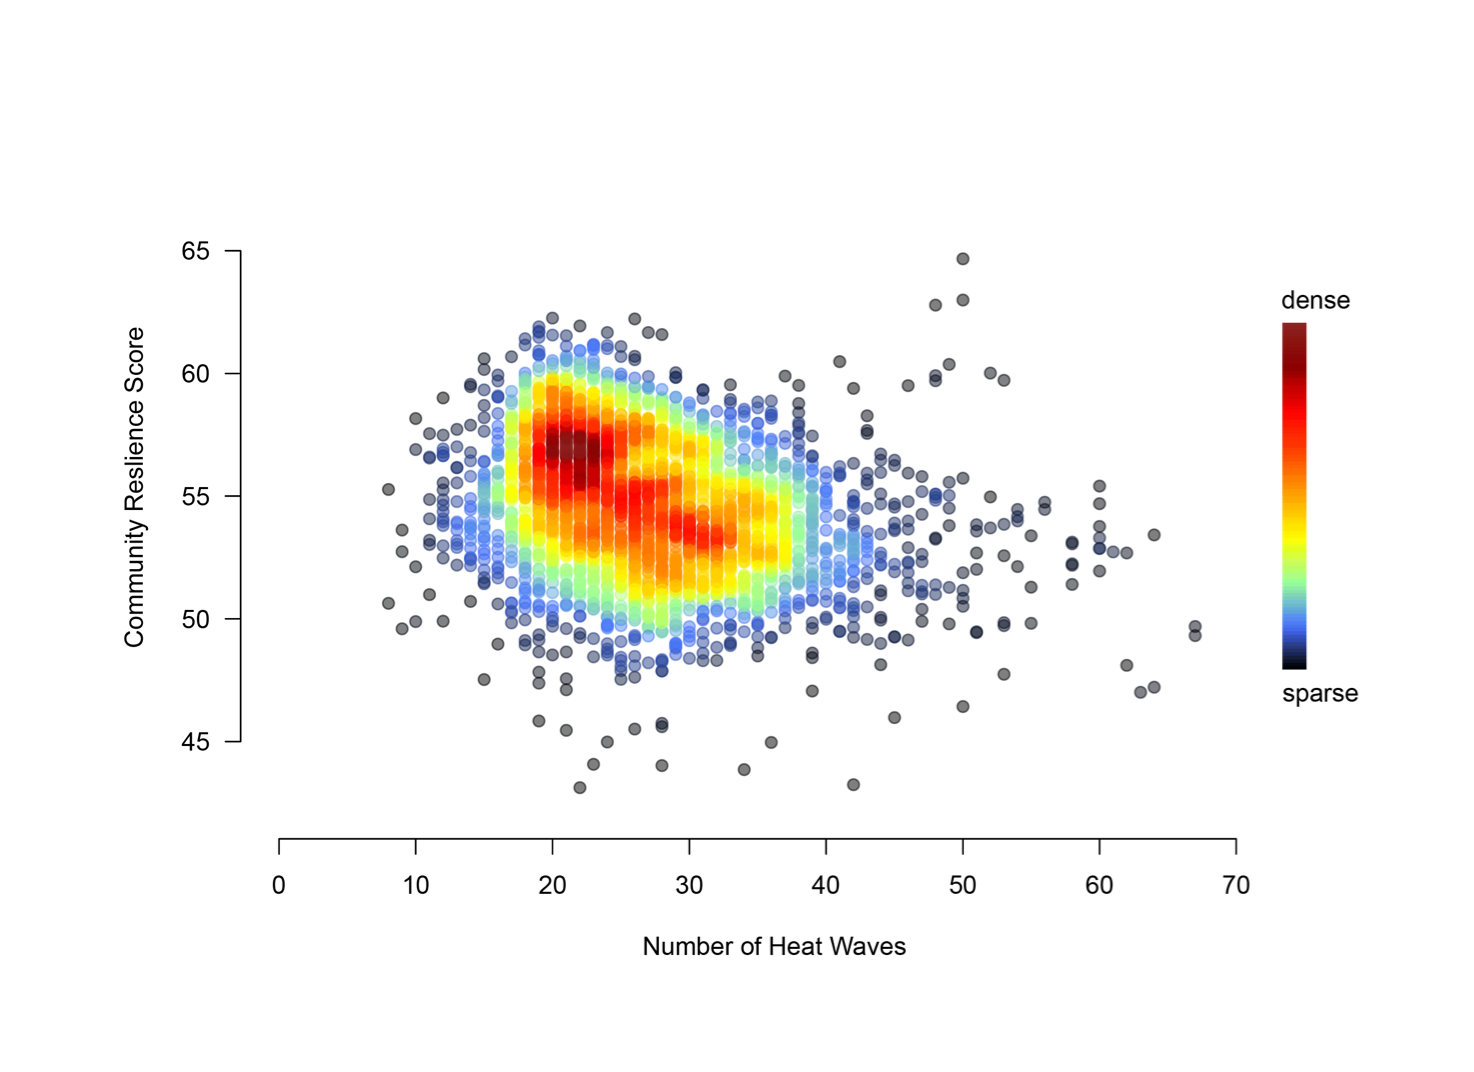
Heat waves are more severe for certain types of communities

Heat waves tend to disproportionately affect communities that are less prepared to mitigate the negative impacts. These data show the correlation between the number of heat waves in the most recent five-year period (2016–2020) and a measure of community-level resilience that’s available through the Federal Emergency Management Agency’s National Risk Index. We see a strong negative correlation between the number of heat waves and the community resilience score (both at the county level); in other words, communities with lower resilience tend to experience more heat waves. We could use the large catalog of county-level measures available on Google Data Commons to further explore which populations are disproportionally exposed to extreme heat. For example, you can view the association between heat wave exposure and median income here.

Fire and Climate
Screenshot from Data Commons
View Timelines
Wildfires are growing in size and severity

Property damage, fatalities, and smoke emissions from US wildfires have increased sharply in recent years. For example, eight of the ten largest fires in US history (in terms of insured property losses) have occurred since 2017. The recent increase in wildfire damages is part of a longer-run increase in wildfire activity across the western Unites States. In the panel on the left, data from the US Geological Survey’s Monitoring Trends in Burn Severity project show that wildfires burned more than twice the area each year on average in the decade 2004–2015 than in the decade 1985–1994. Fires have grown more severe over time, too. Among wildfire scientists, fire “severity” refers to the extent that the fire changes a site’s vegetation and soils. Fire severity was highly variable in the 1980s and 1990s, partly because relatively few acres burned during this time. However, since the 1990s, the percentage of forest burned at high severity has climbed, as shown by data from Parks and Abatzoglou (2020) in the panel on the right.

Screenshot from Data Commons
View Maps
Area burned has grown in wildfire-prone regions

Wildfires have increased their geographic footprint in the western United States, based on data from the US Geological Survey’s Monitoring Trends in Burn Severity project. In the decade 1985–1994, the average percentage of land area that burned within a county in a given year was highest in counties in central Idaho and the Yellowstone region, due in part to the famous Yellowstone fires of 1988. In the decade 2005–2014, much of the western United States saw notable increases in the percentage of land burned, with wildfires extending their range throughout Idaho, the Cascade Range of Oregon and Washington, northern California, and the southern coast of California.

Screenshot from Data Commons
View Scatterplot
Climate change drives larger and more severe fires

The increase in wildfire activity in the western United States has been caused by abundant fuels, an increase in ignition sources, and other factors, with climate change playing an important role. Data from Parks and Abatzoglou are shown here, with the percent of forest area that burned in western US states in 2016 plotted against a relevant climate measure: vapor pressure deficit (VPD). In fire science, VPD frequently is used as a measure of dryness; it measures the difference between the amount of moisture in the air and the amount of moisture the air can hold when saturated. Vegetation tends to dry out and become more flammable when VPD is high. This figure shows that, in states that were relatively dryer in 2016 (when VPD was relatively high), the share of forest area burned tended to be higher. This relationship holds in most years, a pattern that you can explore in RFF Data Commons.

Wildfire Smoke
Screenshot from Data Commons
View Timeline
Wildfire is a major contributor to unhealthy particulate matter in the United States

In the United States, exposure to wildfire smoke has increased sharply in recent years. One of the most damaging pollutants from wildfires is PM2.5, or particulate matter that’s smaller than 2.5 microns in diameter. PM2.5 comprises a mixture of chemicals that can lodge deep within human lungs and even enter our bloodstreams. Numerous scientific studies have linked PM2.5 to health problems, including asthma, heart attacks, and premature death. This plot shows concentrations of PM2.5 that are attributable to wildfire smoke across the United States during the period 2006–2020. These concentrations were estimated by researchers at Stanford University using statistical modeling and artificial intelligence. PM2.5 concentrations above a threshold of 35 micrograms per meters cubed (dotted horizontal line) are considered harmful to public health and are in violation of the National Ambient Air Quality Standards (NAAQS) as established by the Clean Air Act. In 2020, wildfires alone caused PM2.5 concentrations to rise above this threshold in seven states.

Screenshot from Data Commons
View Maps
Risk of exposure to wildfire smoke has increased across the United States

We can use these data to visualize where Americans are most at risk of being exposed to wildfire smoke and how this risk is evolving over time. For the period 2006–2010 (top), 226 counties (home to 48 million Americans) exceeded the NAAQS standard for at least one day. Just 10 years later, during the period 2016–2020 (bottom), the number of counties that similarly exceeded the NAAQS standard more than doubled, growing to 518 counties that represent 71 million Americans.

Screenshot from Data Commons
View Scatterplots
Particulate matter from wildfire smoke combines with pollution from other sources

Wildfire smoke poses a significant threat to human health and the environment in the American West. In addition, PM2.5 from wildfires and other sources can combine to create hazardous conditions throughout the United States. On July 1, 2015 (top), wildfires explained 69 percent of the variation (R2 = 0.69) in total PM2.5 concentrations in the western United States, 57 percent in the Midwest, 83 percent in the South, and 91 percent in the Northeast. The year 2015 was hard hit by wildfires, which were a contributing factor on nearly half of all days that harbored harmful levels of PM2.5 across the United States. But wildfire need not drive up PM2.5 concentrations if we can keep the burning under control. On the same date in 2014 (bottom), a year with far less area burned and far less wildfire smoke, wildfires explained only 44 percent of the variation in PM2.5 concentrations in the West and less than 1 percent in all other regions.